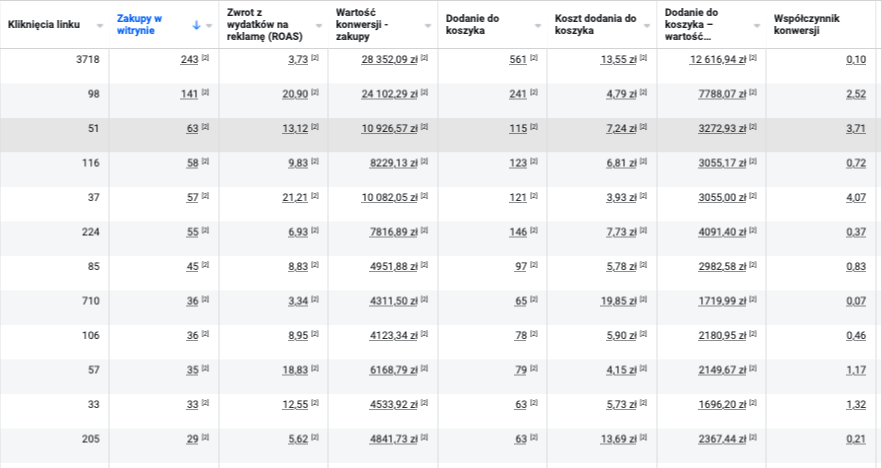
There is a lot of talk about data analytics in the Meta Advertising (formerly Facebook Ads) system. The power of the pixel or the need to set and monitor KPIs is often raised. Most often, it’s simply CPC, ROAS, or cost per acquisition. Even though I’ve been in the industry for almost ten years now, I’ve never heard of anyone monitoring conversion rate or any other custom metric that isn’t available in the ad manager at first glance. I’ll walk you through Meta Ads’ custom indicator tool in today’s article. This knowledge can be precious to you, as it can significantly affect the speed and efficiency of data analysis in your Meta Ads campaigns.
What is a custom indicator?
Let’s start at the beginning.
What really is a custom indicator and where can we find it?
A custom indicator is data that we want to monitor, but the Meta advertising system doesn’t provide it in the default reporting version. In other words, you won’t find it in the columns with the other statistics, which, after all, are many. There are clicks, reach, views, video views, add to cart, purchases or CTR, among others.

Conversion rate as a custom indicator – step by step guidance
One of the most important performance indicators of an ad campaign is the conversion rate. I personally lacked this data in the ad manager, so I just created this indicator myself 🙂
Just on this example I will show you how you too can create your own custom indicators.
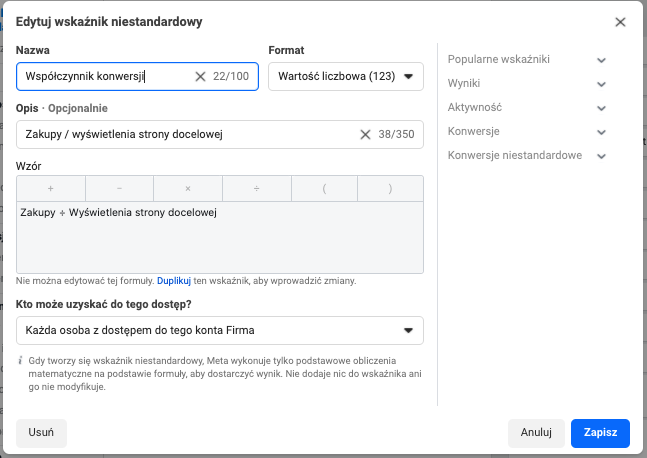
We begin our journey with the default statistics view in the ad manager. We head to the top right corner of the page, to the columns button. We click and from the drop down select Customize Columns and then at the top of the tab look for the Create Custom Indicator button. Once you click it, a wizard will open up for you, exactly as in the screengrab below.

The first three fields to be completed are the name, description and the format in which the results should be displayed. Here the matter is simple, it is about naming, which will allow you to identify the indicator in a maze of other statistics. As for the format, you can choose between numeric, percentage or currency. It’s just a matter of how the data will be shown. For conversion rate, percentage or numeric formats would be ideal. If, for example, we would like to create an indicator calculating the average value of each click, then we can easily use the currency format, so that the data are presented in EUR or any other currency.
Just below is the most important part – the place where we give the formula for our coefficient. In the case of the conversion rate, it will obviously be the Number of conversions divided by the number of impressions of the landing page. If 1 out of 100 visitors to a landing page under the influence of Facebook or Instagram ads make a conversion, then the conversion rate is 1%.
Remember, however, that we can only choose from the data that Facebook collects. This means that if we want to calculate the conversion rate for e-commerce, we have to provide the formula according to the Meta Ads nomenclature. Here’s the formula:
website purchases / displays
Okay, we already have the formula. Now all you have to do is select in the menu below whether Only you can use this indicator, or whether anyone with access to the advertising account can do so.
Discover the full capabilities of Meta Ad custom indicators
What other indicators can you create? Well, you are limited only by your imagination and mathematics. At Happy Parrots we use a proprietary ratio that calculates the potential of a set of ads based on:
- Landing page displays
- Add to cart
- Purchase
Each event is assigned a certain weight, so we don’t just suggest ROAS and waste time analyzing each set of ads separately. Some processes can be automated and this is what we try to do. By using the Happy Parrots factor we are able to assess within seconds which campaigns have a good return and high potential. Because sometimes it may happen that a campaign generates low return, but a lot of additions to the basket and traffic to the website, which is then closed in remarketing
By using this ratio, we reduced the average weekly campaign optimization time for each ad account from 4 hours to 30 minutes.
Want to know our ratio to save you up to 14 hours per month?
Summary
The entry barrier to play with custom indicators is not high, and the benefits can save you a lot of time and significantly improve the performance of your ad campaigns.


